AI Build-Out
Visualization
Project
The AI boom is taking physical shape. See the buildings, machines, money and resources behind it.
Explore the buildoutPut the whole industry next to a city.
The world’s data centers occupy an estimated 1.4 Manhattans of powered land and use as much electricity annually as 9.7 New York Cities. Their annual water footprint has the volume of about 149 days of NYC’s water supply.
Worldwide data-center sector, including AI. These totals put the buildout in context. They include other computing and pre-boom facilities; the evidence years differ. A complete global AI-only total is not yet available.
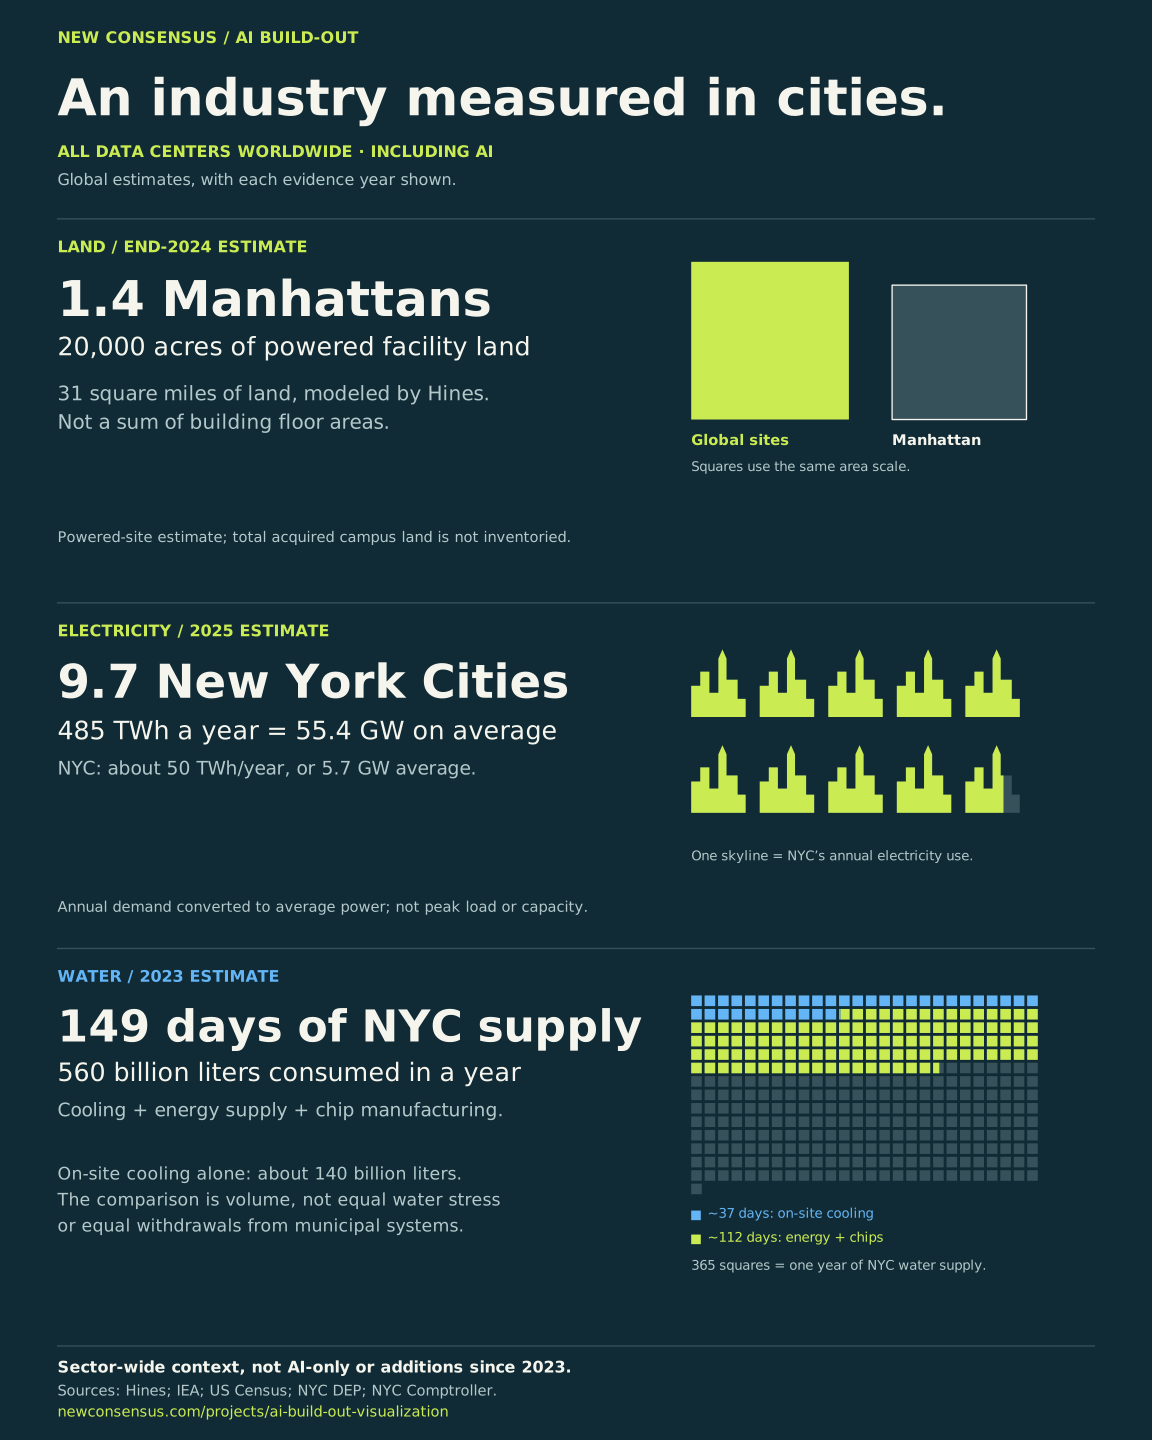
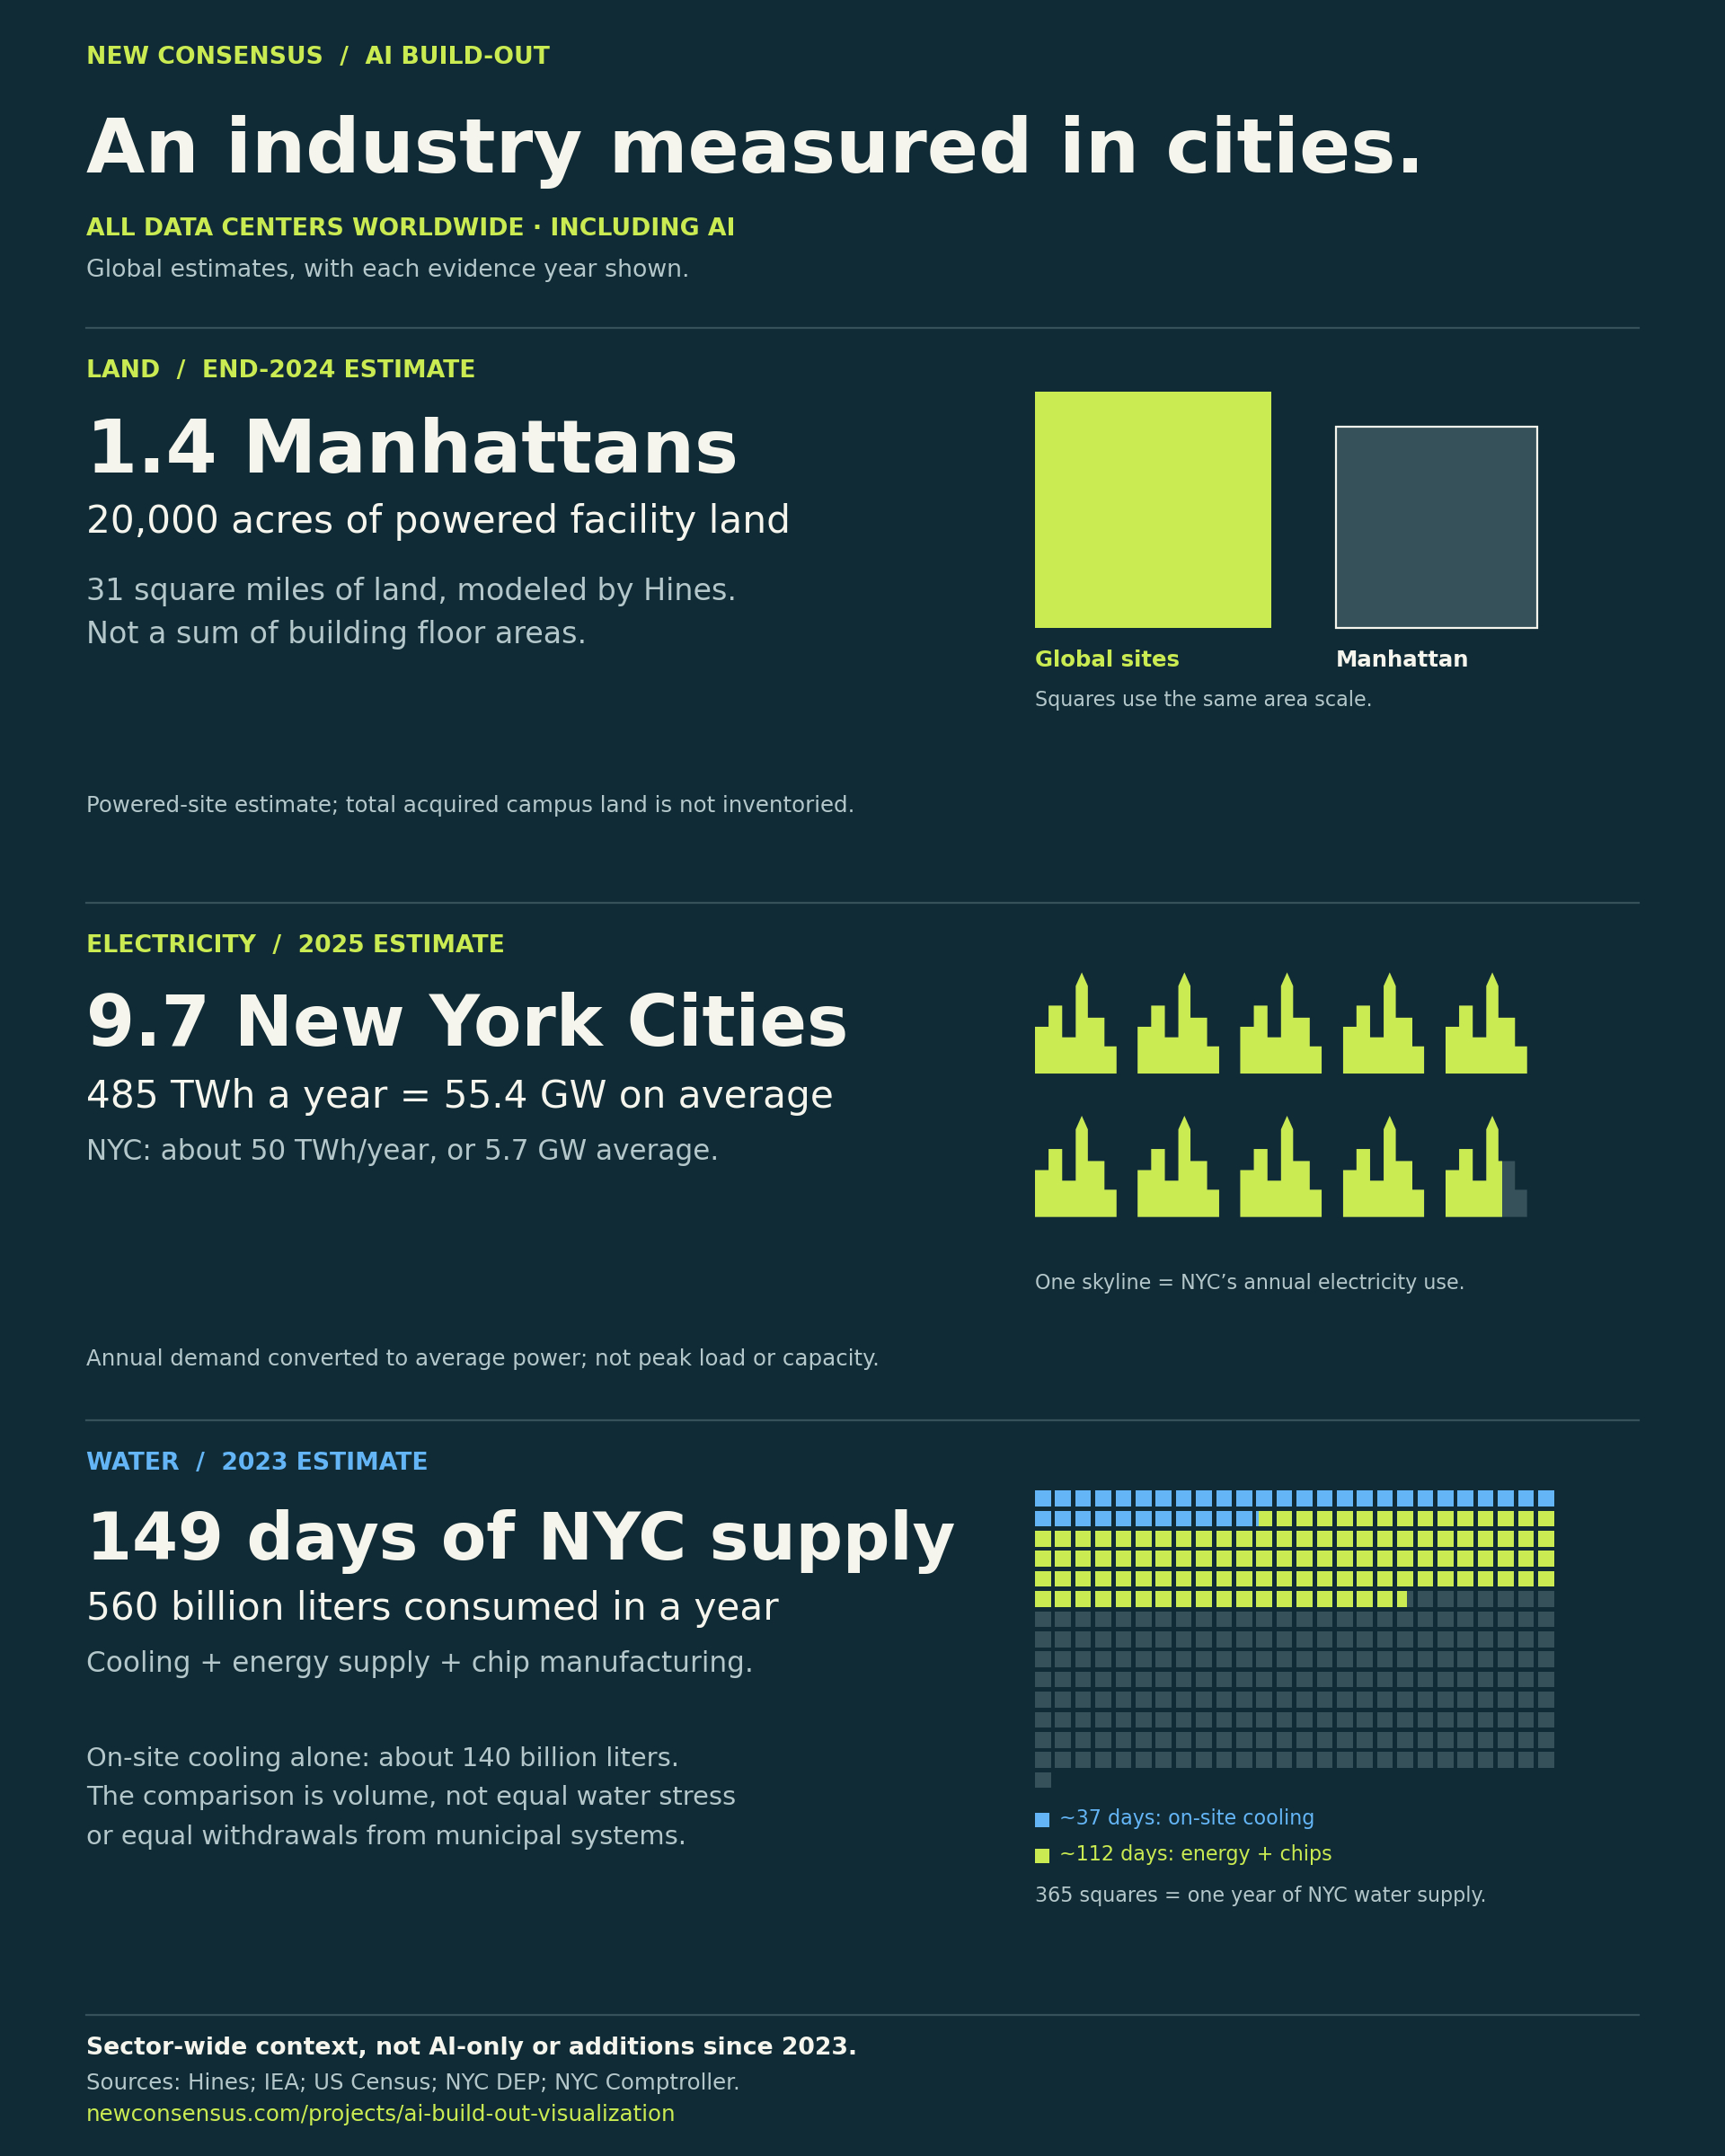
Land means facility sites. The acreage is Hines’s model of powered land under operating data centers, rather than building floor space. It is not a survey of entire acquired campuses, buffers or reserved expansion land. A complete worldwide campus-acreage total remains unknown.
Water means consumption. The 560-billion-liter footprint includes cooling, energy supply and chip manufacturing. About one-quarter is direct cooling. NYC’s benchmark is water delivered to the city, so the comparison shows an equivalent volume—not equal withdrawals or equal local water stress.
Sources, dates and the arithmetic behind the city comparisons
These are worldwide sector estimates, rather than sums of our 96 AI-site records. Their evidence years differ: land is end-2024, electricity is 2025, and water is 2023. They include infrastructure that predates the AI boom. They cannot be presented as an AI-only total or as net construction since 2023.
| Measure | Global estimate | City benchmark | Calculation |
|---|---|---|---|
| Powered facility land | 20,000 acres, end-2024 | Manhattan: 22.7 square miles × 640 acres | 20,000 ÷ 14,528 = 1.38 Manhattans |
| Annual electricity | 485 TWh, 2025 | NYC: approximately 50 TWh/year | 485 ÷ 50 = 9.7 NYC equivalents |
| Average electrical demand | 55.4 GW | NYC: approximately 5.7 GW | 485 TWh ÷ 8,760 hours × 1,000 = 55.4 GW |
| Annual water consumption | 560 billion liters, 2023 | NYC: 363.4 billion US gallons delivered in 2025 | 560 ÷ 3.785411784 ÷ 363.4 × 365 = 148.6 supply-days |
| Direct cooling component | Approximately 140 billion liters | The same NYC supply benchmark | About one-quarter of the water total = 37.1 supply-days |
The water calendar shows one year of NYC supply volume, with approximately 37 days colored for cooling and 112 for indirect consumption. These components are rounded estimates. A skyline represents annual electricity demand, not population or peak generation capacity. The land squares have proportional areas.
- Hines Research: Power Play: The Emerging Powered Land Opportunity. End-2024 modeled operational powered land; approximately 3.5 MW per acre. Not a parcel census or all operator-owned land.
- IEA: Energy and AI. 2023 global water consumption: direct cooling, energy supply and chip manufacture. Cooling approximately one-quarter.
- IEA: Key Questions on Energy and AI. 2025 global electricity consumption, all data-center workloads.
- US Census Bureau: Manhattan borough profile. 22.7 square miles of land, rounded Census profile value.
- NYC Department of Environmental Protection: 2025 Drinking Water Supply and Quality Report. 363.4 billion US gallons delivered to NYC in calendar 2025. Excludes additional deliveries outside the city.
- NYC Comptroller: Meeting New York City’s Energy Demand Challenge. Approximately 50,000 GWh annually for Zone J / NYC, not just city-government buildings.
Sources: Hines Research, September 2025, p. 3; IEA, 2026 electricity outlook; IEA, Energy and AI, pp. 242–243. City benchmarks: US Census, NYC Comptroller and NYC DEP. Download inputs and calculations.
A global buildout. An uneven view.
Our documented sample spans 12 countries. Most records are in the United States; the map shows where this inventory has evidence, not every place AI infrastructure exists.
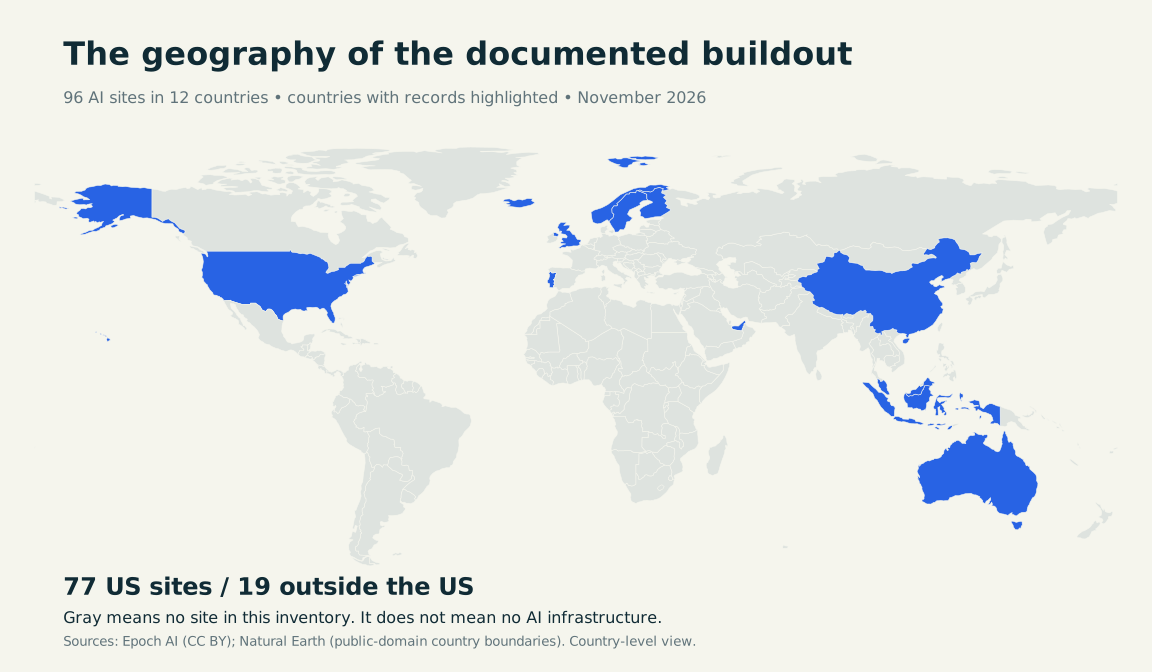
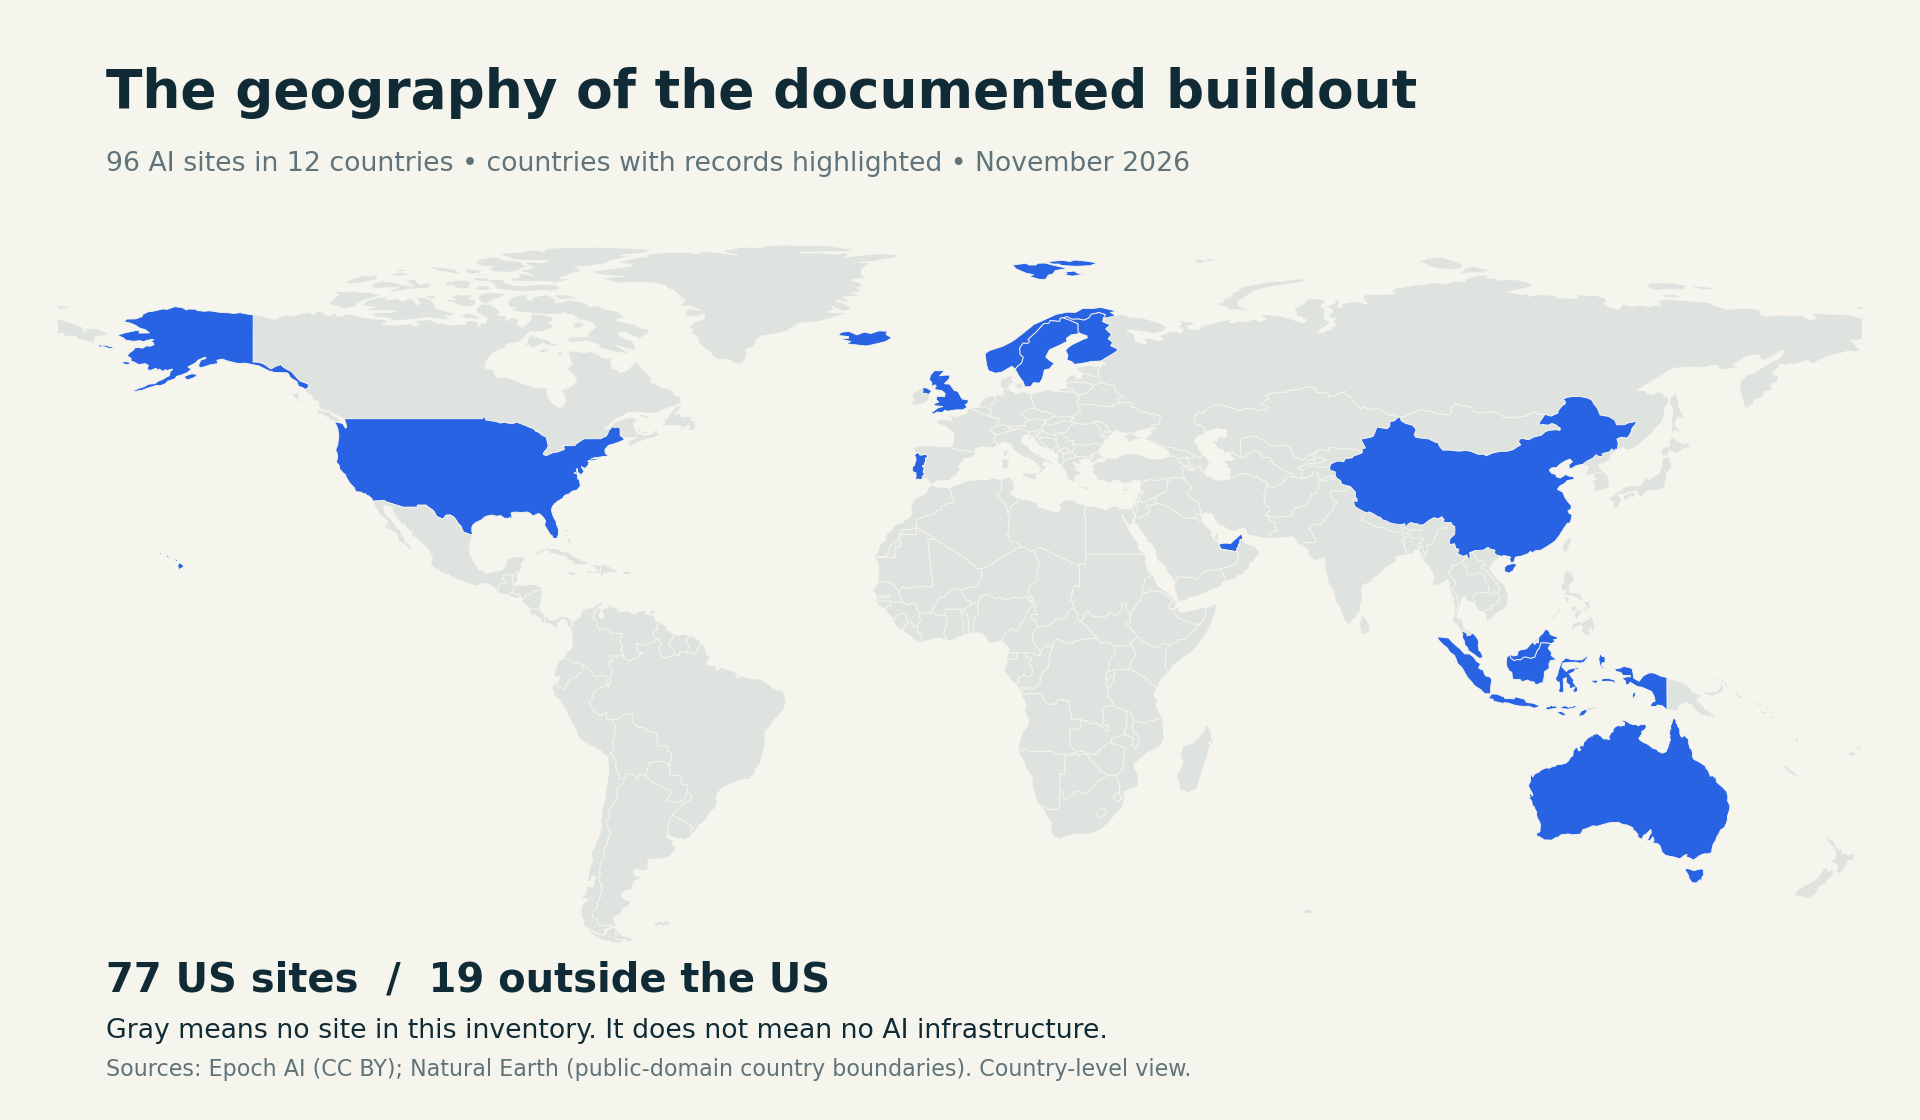
Source: Epoch AI site inventory, November 1, 2026. Country boundaries: Natural Earth. Site records may encompass several buildings.
Completed does not mean gone.
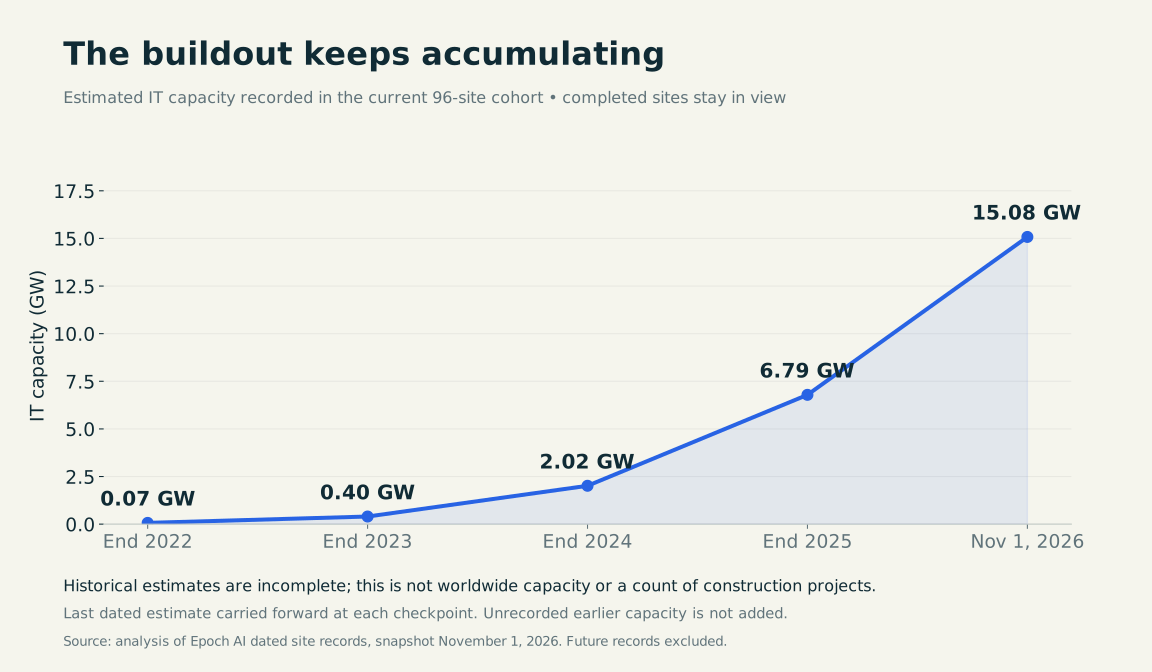
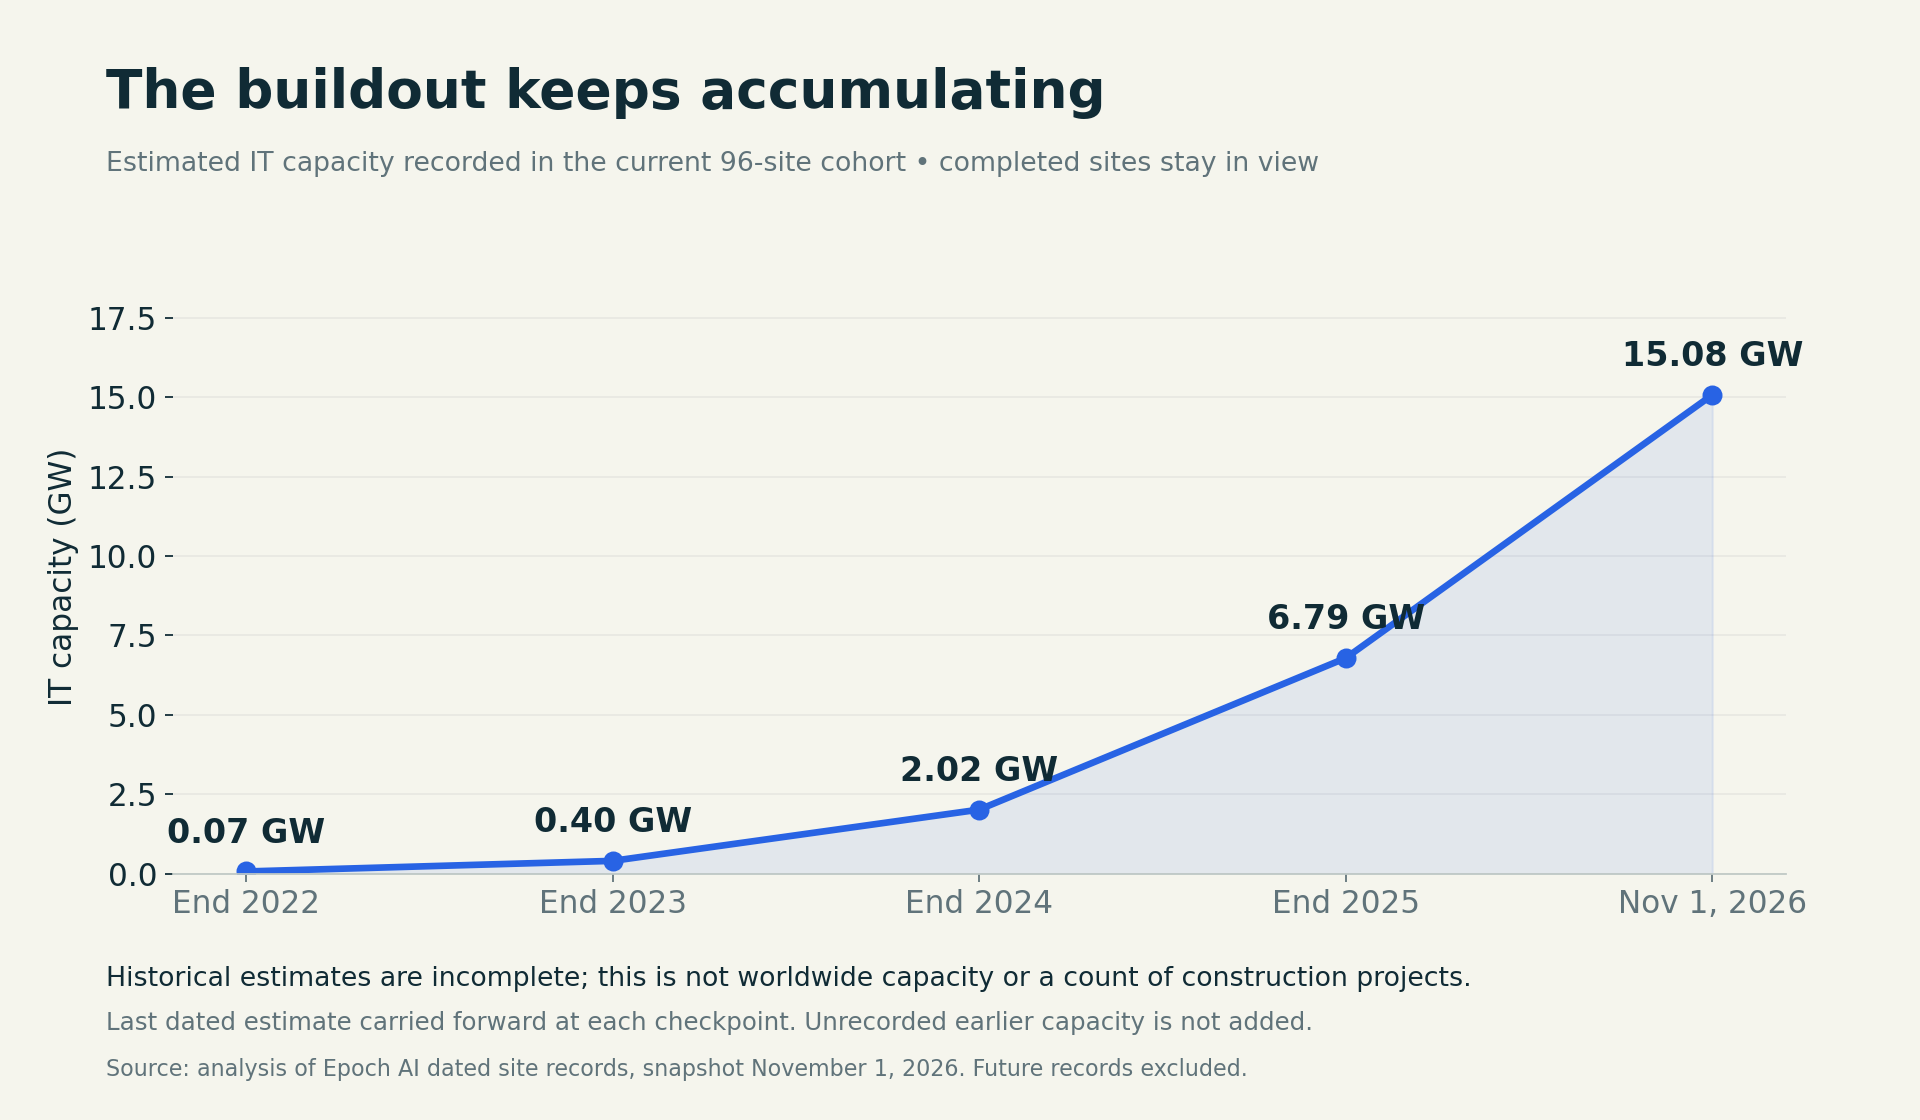
Once a site starts operating, its capacity remains in the picture. Dated estimates for the current cohort record growth from 0.40 GW at the end of 2023 to 15.08 GW in November 2026. Earlier records are incomplete, so this is a history of the tracked cohort, not a worldwide growth rate.
76 sites with positive current estimates. These may include operating buildings on campuses that are still expanding.
20 with no positive current capacity. Their ultimate size and cost are not zero; future capacity is excluded from the operating total.
Historical checkpoints and counting method
At each checkpoint, we sum the last dated IT-capacity estimate for each site. The cohort stays fixed at the 96 sites in the current snapshot. A site without an earlier record contributes no recorded capacity at that date; this does not establish that it had no physical capacity. Future-dated estimates are excluded. These stock estimates are not a sum of all investment or of all capacity additions.
| Date | Recorded IT capacity | Sites with positive estimates | Sites with dated records |
|---|---|---|---|
| 2022-12-31 | 0.067 GW | 2 | 25 |
| 2023-12-31 | 0.401 GW | 6 | 47 |
| 2024-12-31 | 2.015 GW | 22 | 79 |
| 2025-12-31 | 6.789 GW | 47 | 95 |
| 2026-11-01 | 15.078 GW | 76 | 96 |
Source: analysis of Epoch AI dated site records. Download the checkpoints.
A million H100s’ worth of performance.
Colossus 2 has the equivalent of roughly 1.11 million H100 GPUs in Epoch’s current estimate. An H100 equivalent compares theoretical computing performance across different chips; it does not mean a site contains that many physical H100s.
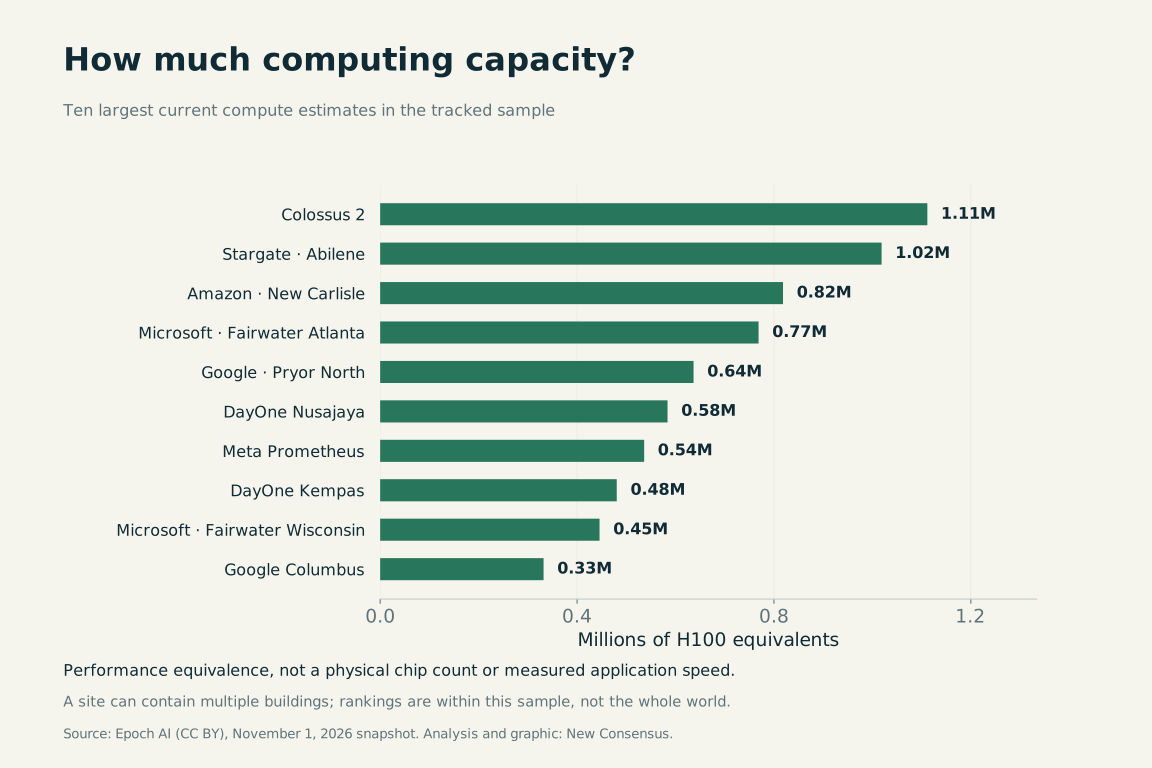
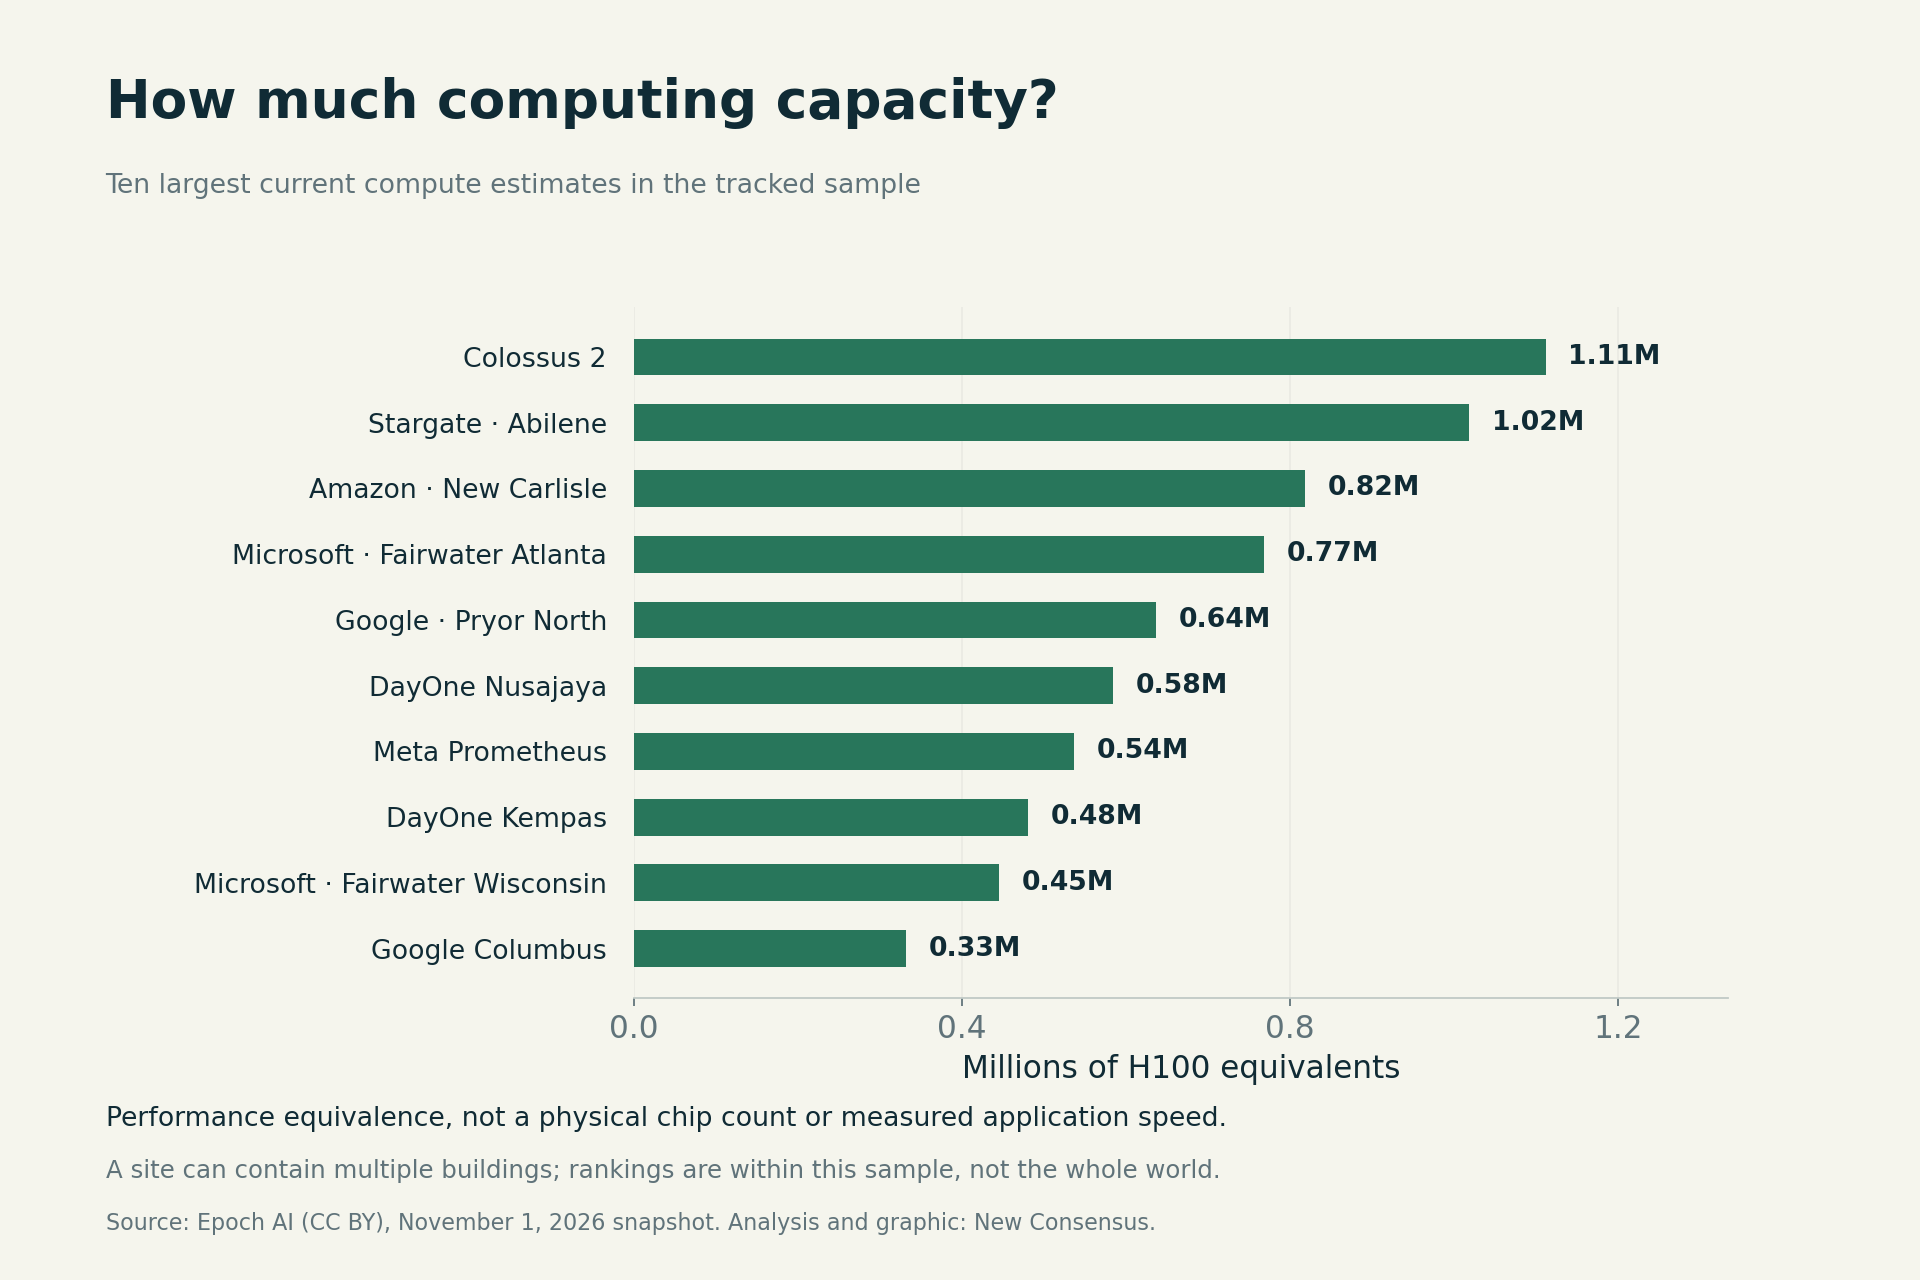
Source: Epoch AI. Performance is based on theoretical dense 8-bit operations, not observed application throughput. Hardware mixes are often inferred. Read the estimation method.
The price of filling the buildings.
The dollar scale includes servers and networking as well as the facility. These comparable estimates put Amazon’s New Carlisle site at about $39.3 billion. They describe modeled capital, not a disclosed invoice, financing deal or annual spending figure.
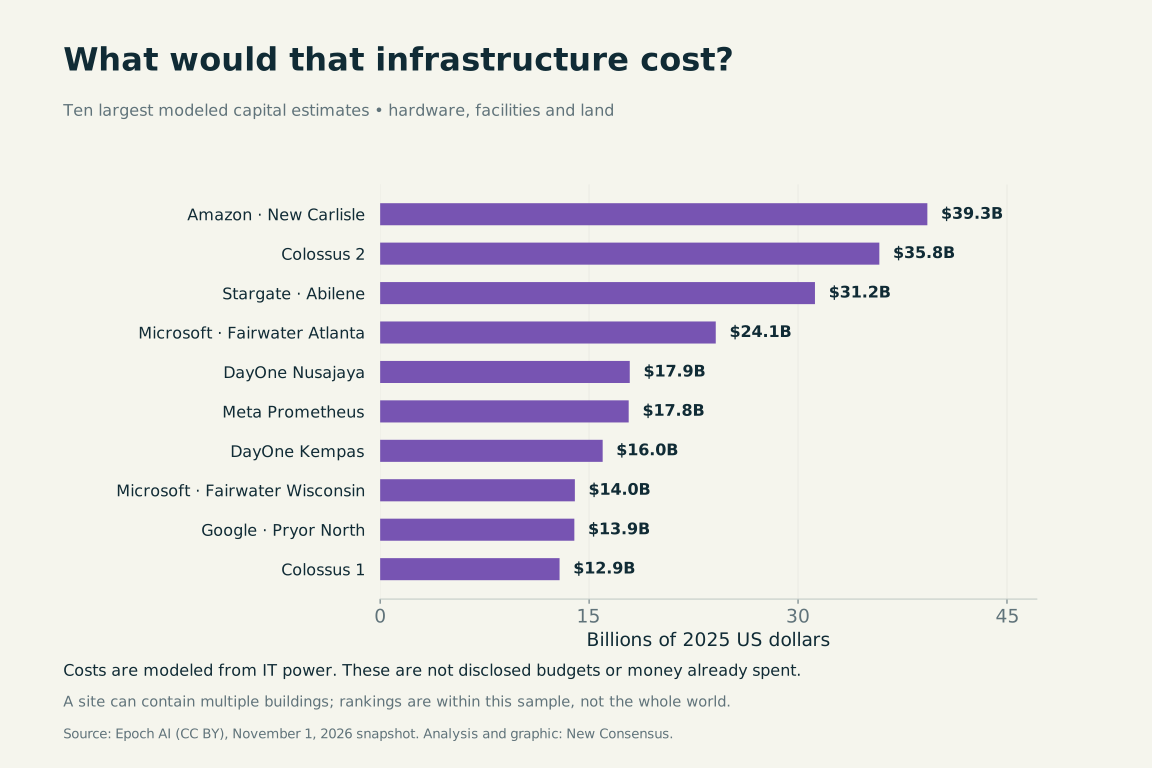
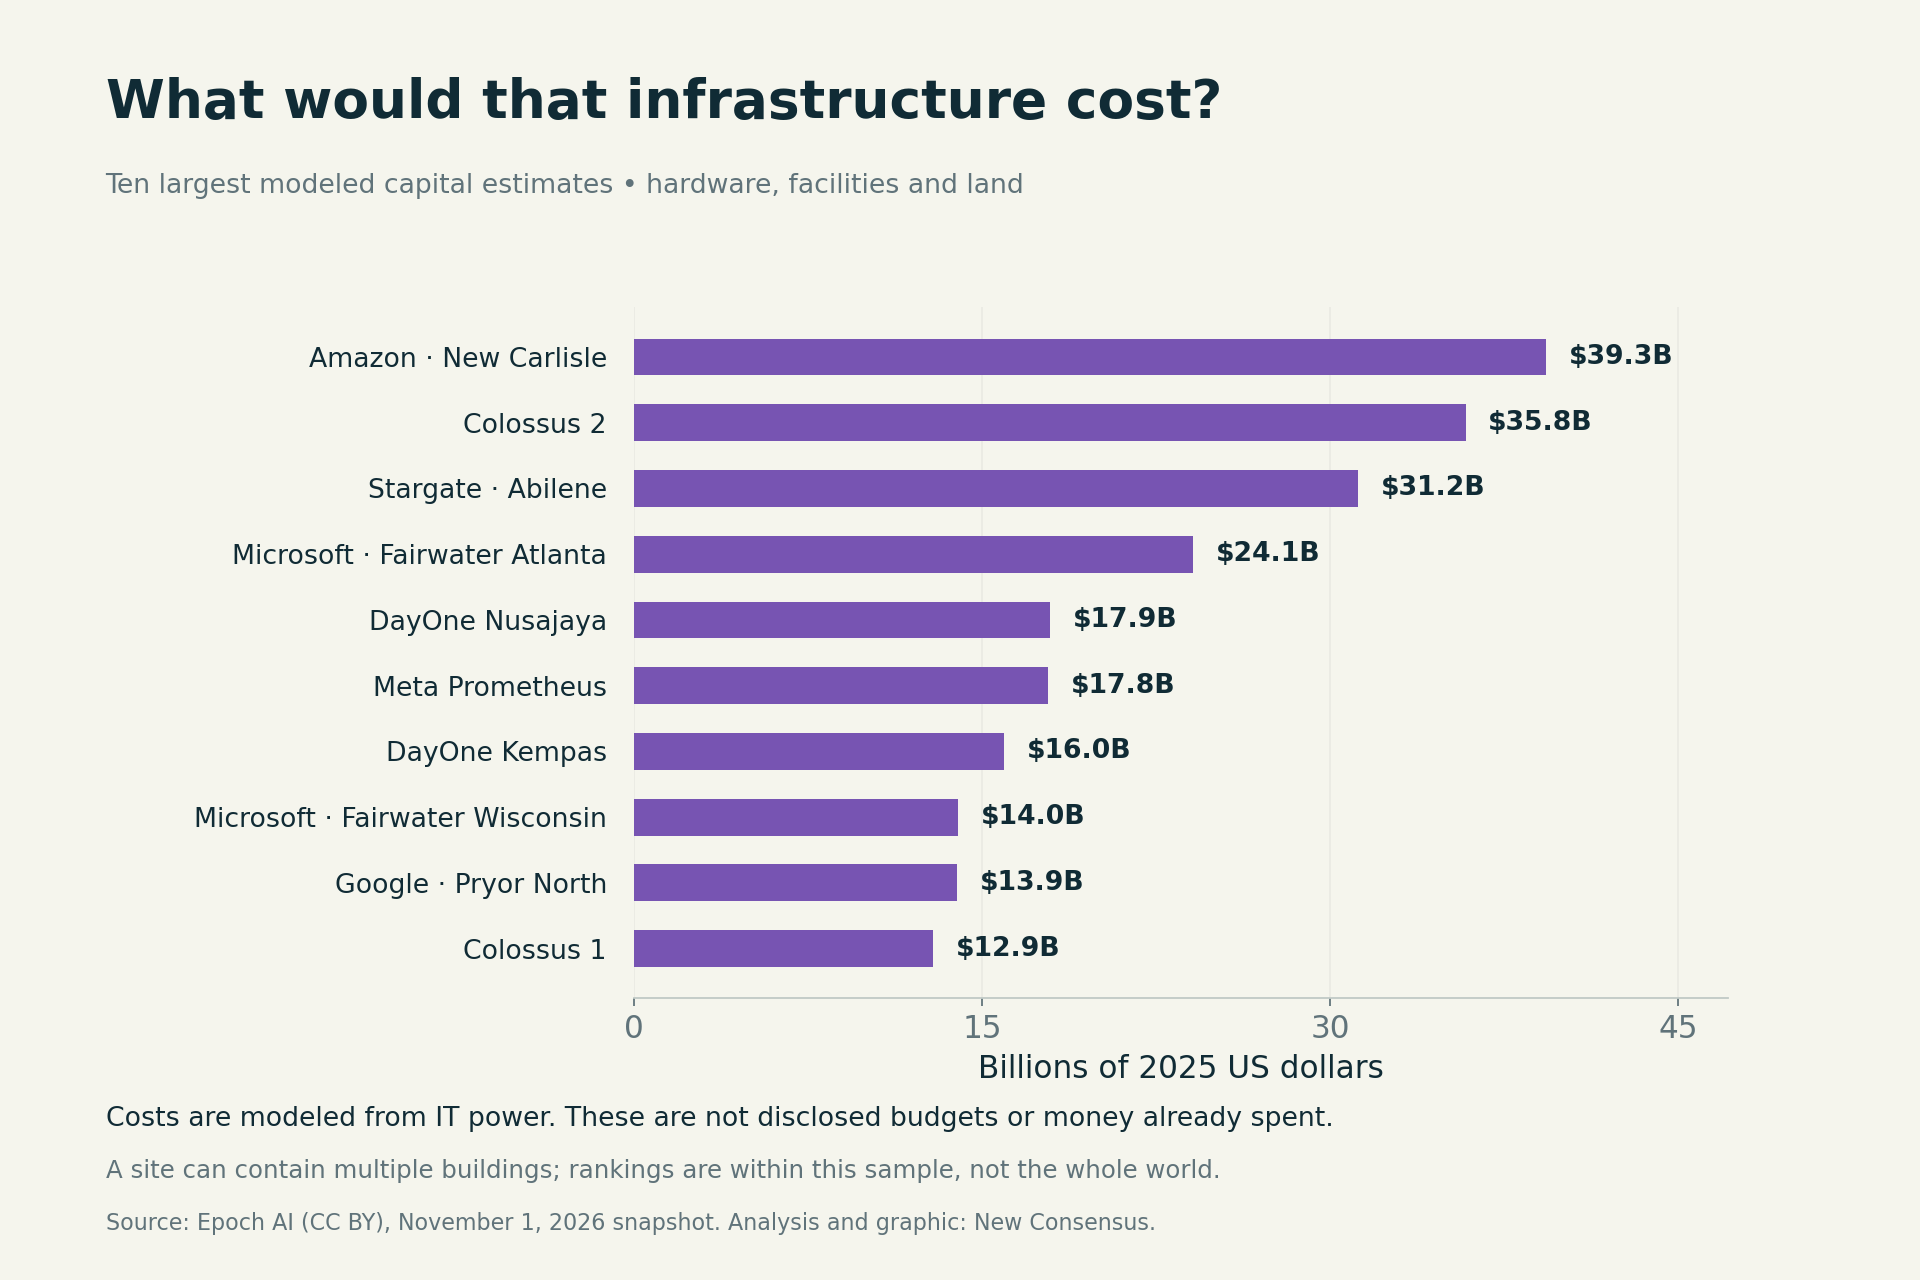
The cost chart and the power figures share an input: Epoch models capital cost from IT power. They are not independent measurements.
Source: Epoch AI capital-cost methodology, November 2026 snapshot. All values in 2025 US dollars.
From campus loads to a global energy demand.
The tracked sites total 15.1 GW of estimated IT capacity. To see the wider electricity context, the IEA estimates that all data centers used 485 TWh in 2025 and projects 950 TWh in 2030. Those global totals include AI and other computing.
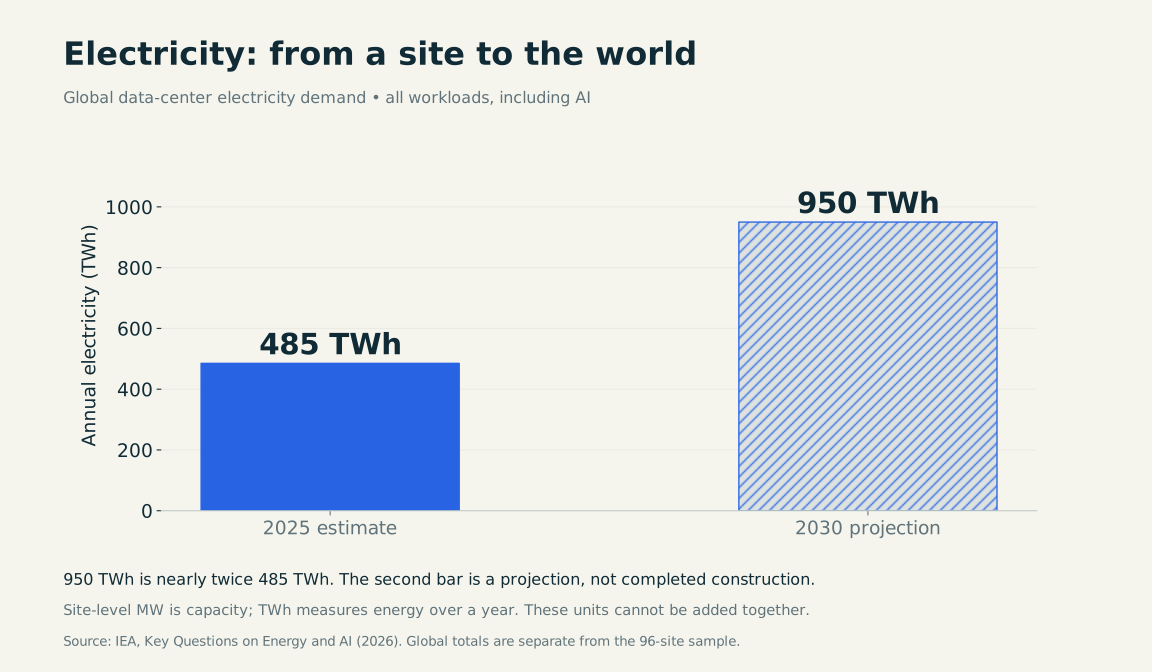
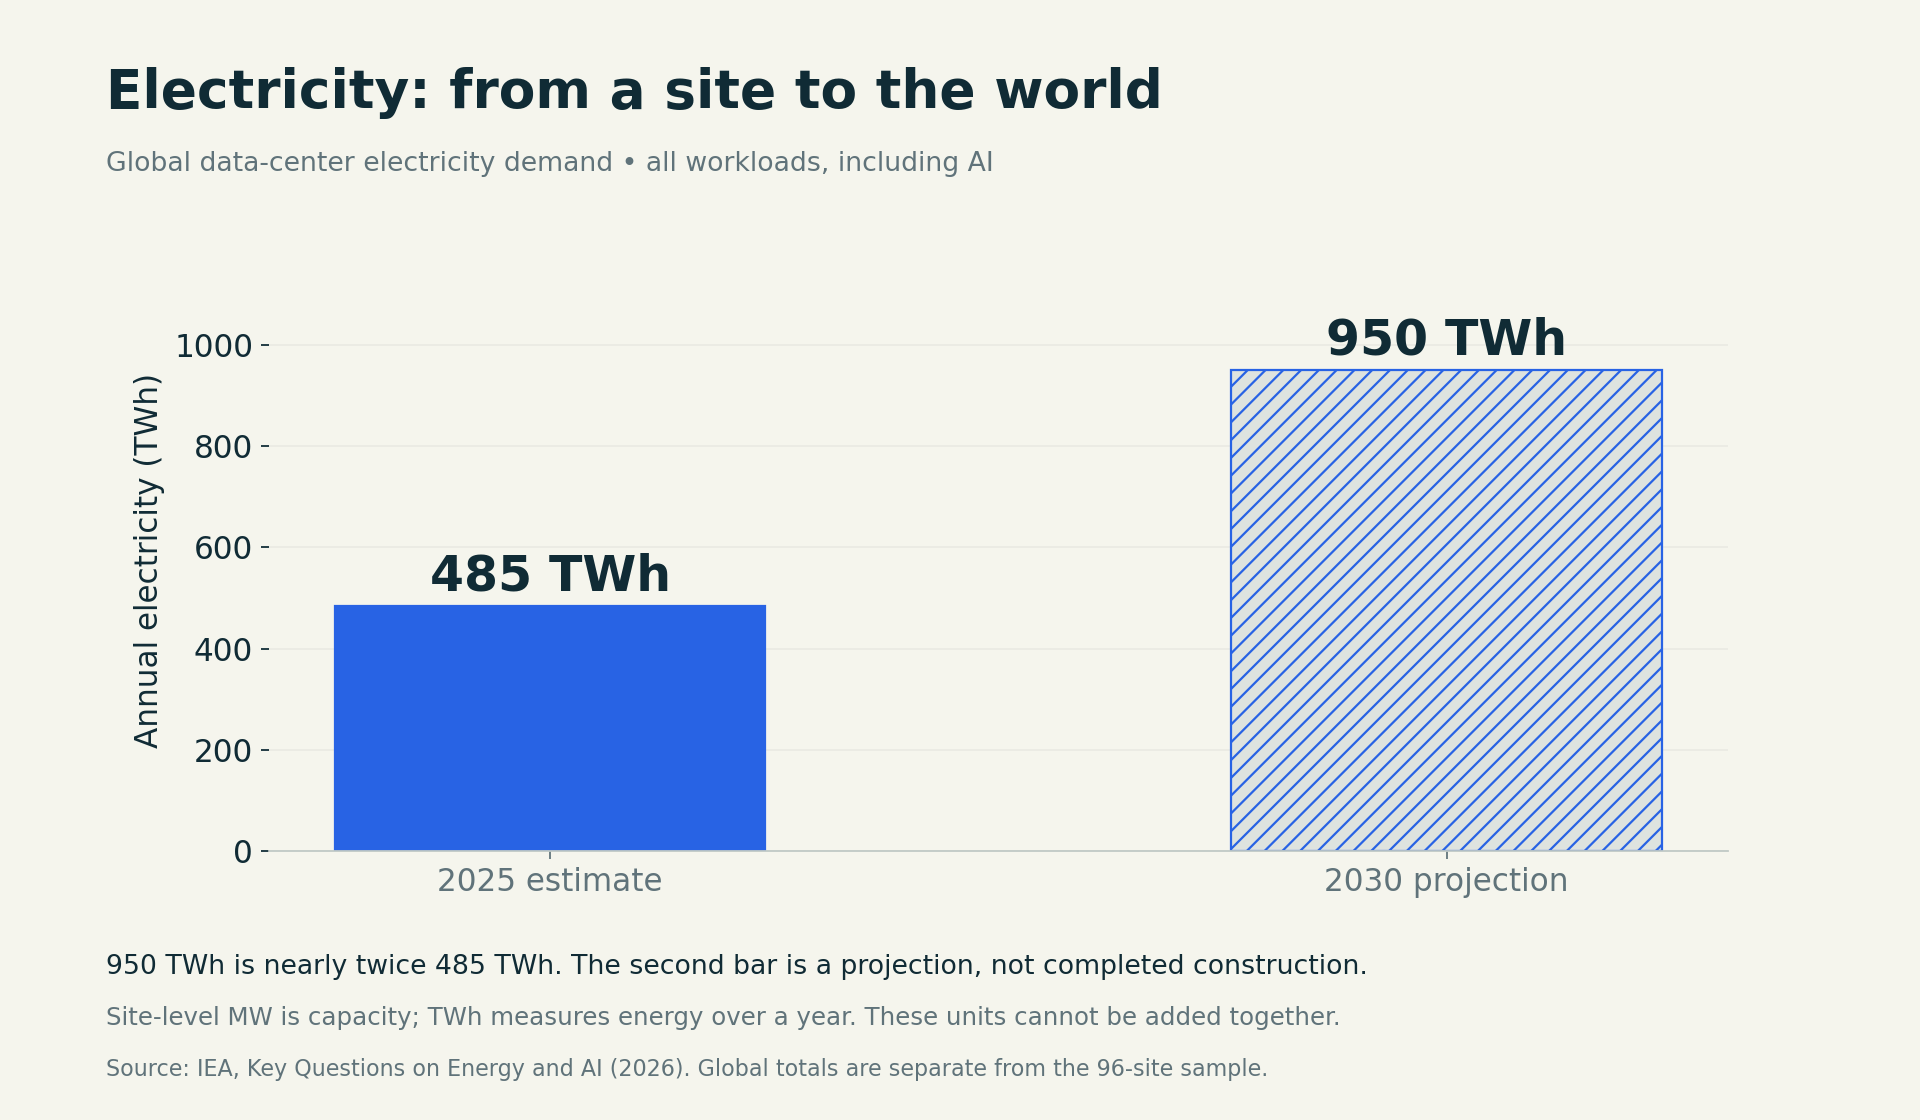
MW tells us how much power. IT capacity covers equipment; cooling and other facility overhead add to the full electrical demand.
TWh tells us how much energy over time. A constant 1 GW load for a 365-day year uses 8.76 TWh. Actual demand varies with utilization and overhead.
Source: IEA, Key Questions on Energy and AI (2026). These global estimates are a different dataset from the campus inventory.
Think in square miles.
Meta’s original Louisiana site boundary covered 2,250 acres, about 3.5 square miles. Microsoft’s initial Fairwater campus in Wisconsin covered 315 acres, about half a square mile. The square areas below use the same scale.
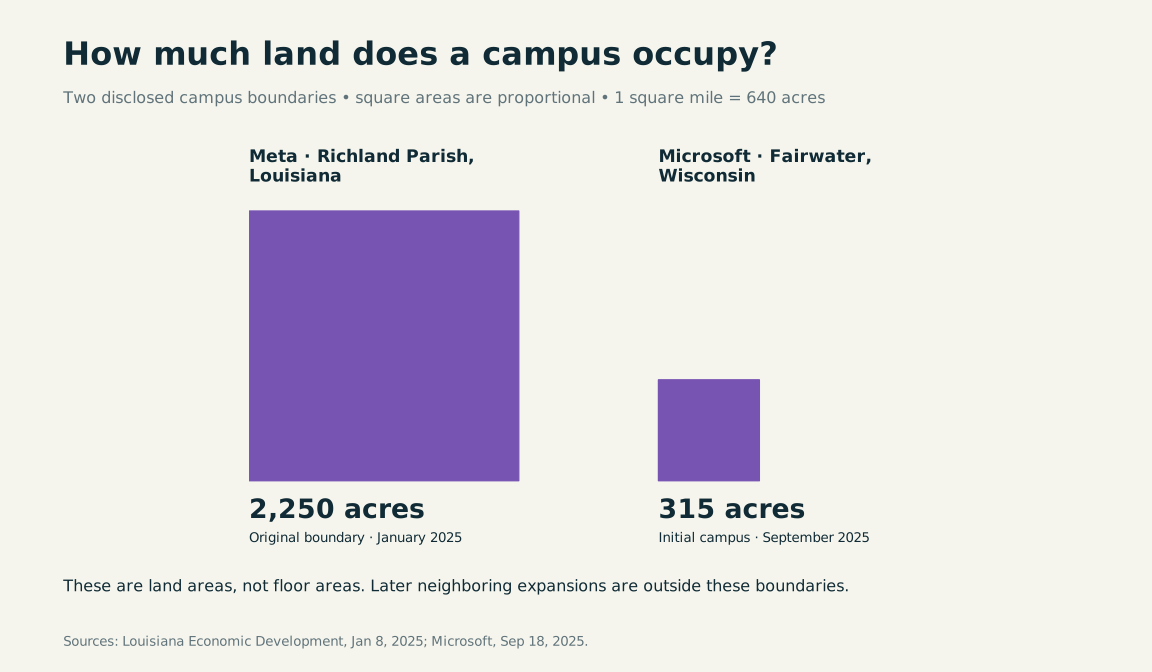
Sources: Louisiana Economic Development, January 8, 2025; Microsoft, September 18, 2025. These are dated land boundaries, not floor space or the full extent of later expansions.
A billion gallons, at a named place.
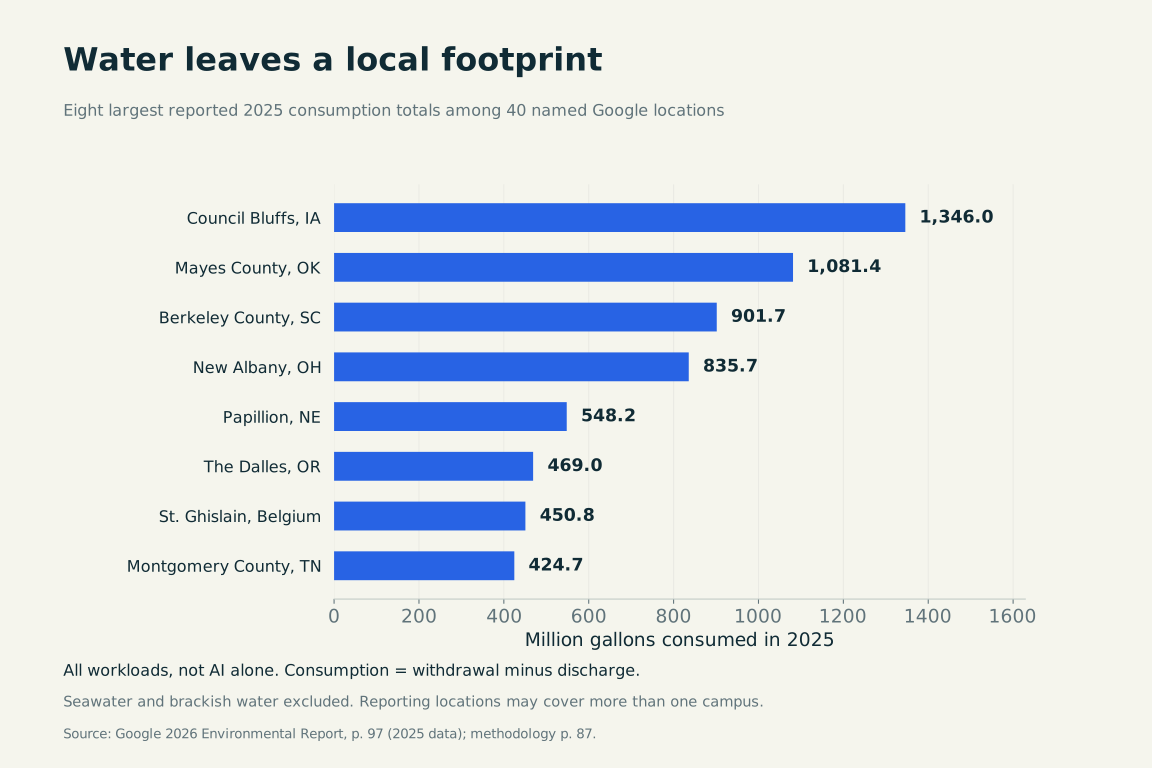
Google reported consuming 1.346 billion gallons at its Council Bluffs location in 2025. Its location-level disclosures give us a view that is often missing elsewhere. They cover all workloads at each reporting location; the portion attributable to AI is not disclosed.
See all 40 named locations
Million gallons during 2025. Consumption is withdrawal minus discharge. Seawater and brackish water are excluded. Low totals can reflect new or partly operating facilities, not just cooling efficiency. See the original report’s footnotes for site-specific conditions.
| Location | Withdrawal | Consumption |
|---|---|---|
| Council Bluffs, IA | 1,746.4 | 1,346 |
| Mayes County, OK | 1,396.7 | 1,081.4 |
| Berkeley County, SC | 988.5 | 901.7 |
| New Albany, OH | 1,008.1 | 835.7 |
| Papillion, NE | 677.8 | 548.2 |
| The Dalles, OR | 654.3 | 469 |
| St. Ghislain, Belgium | 714.4 | 450.8 |
| Montgomery County, TN | 499.5 | 424.7 |
| Eemshaven, Netherlands | 532.2 | 405.7 |
| Douglas County, GA | 440.6 | 367.1 |
| Lockbourne, OH | 460.8 | 359.5 |
| Lenoir, NC | 378.3 | 344.3 |
| Bristow, VA | 359.6 | 267.6 |
| Henderson, NV | 401.7 | 239.4 |
| Midlothian, TX | 263.6 | 220.2 |
| Sterling, VA | 258.4 | 199.8 |
| Leesburg, VA | 238.1 | 190.7 |
| Omaha, NE | 241.8 | 183.9 |
| Jackson County, AL | 191 | 173.6 |
| Quilicura, Chile | 278.2 | 143 |
| Lancaster, OH | 307.1 | 135.8 |
| Inzai, Japan | 94.6 | 73.2 |
| Fredericia, Denmark | 88.8 | 71.8 |
| Ashburn, VA | 76.5 | 53.2 |
| Red Oak, TX | 67 | 50.4 |
| New Haven, IN | 62.2 | 37.8 |
| Mesa, AZ | 19.4 | 9.7 |
| Middenmeer, Netherlands | 13.6 | 9.3 |
| Storey County, NV [233] | 66.7 | 6.7 |
| Hanau, Germany | 3.4 | 1.9 |
| Hamina, Finland | 4.3 | 0.4 |
| Wilmer, TX [235] | 2.6 | 0.3 |
| Frankfurt, Germany | 1.2 | 0.2 |
| Sydney, Australia [234] | 1.4 | 0.2 |
| Dublin, Ireland [226] | 0.5 | 0.1 |
| Montreal, Canada [228] | 0.3 | 0.1 |
| Pflugerville, TX [229] | 0.4 | 0.1 |
| Phoenix, AZ [230] | 0.5 | 0.1 |
| San Bernardo, Chile [231] | 0.9 | 0.1 |
| Winschoten, Netherlands | 0.1 | 0.05 |
Source: Google 2026 Environmental Report, page 97; methodology, page 87. Download all rows and source footnote references.
The missing part of the picture.
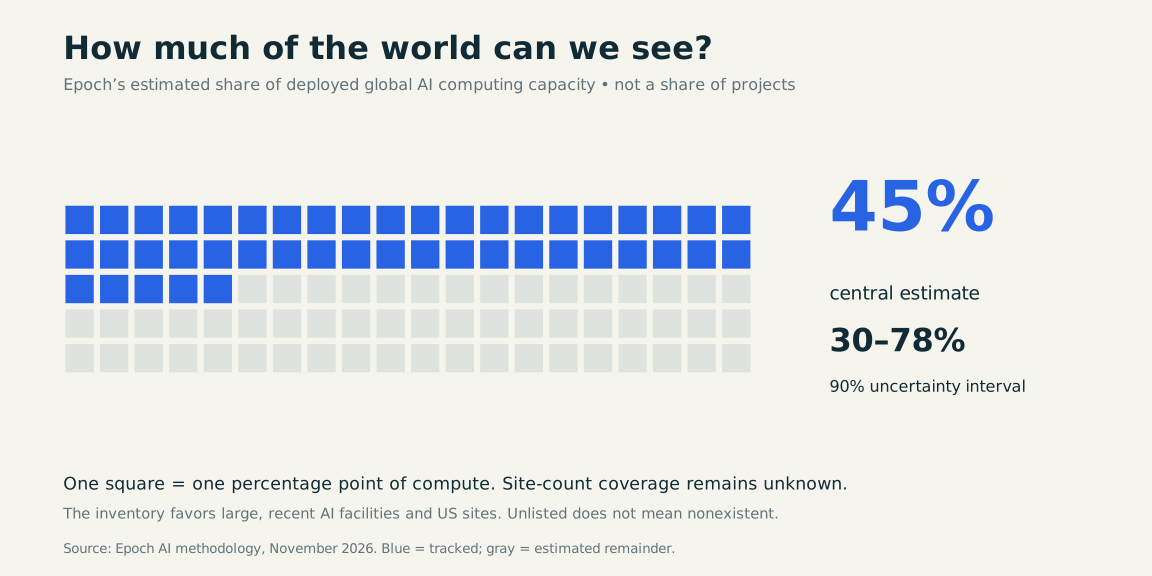
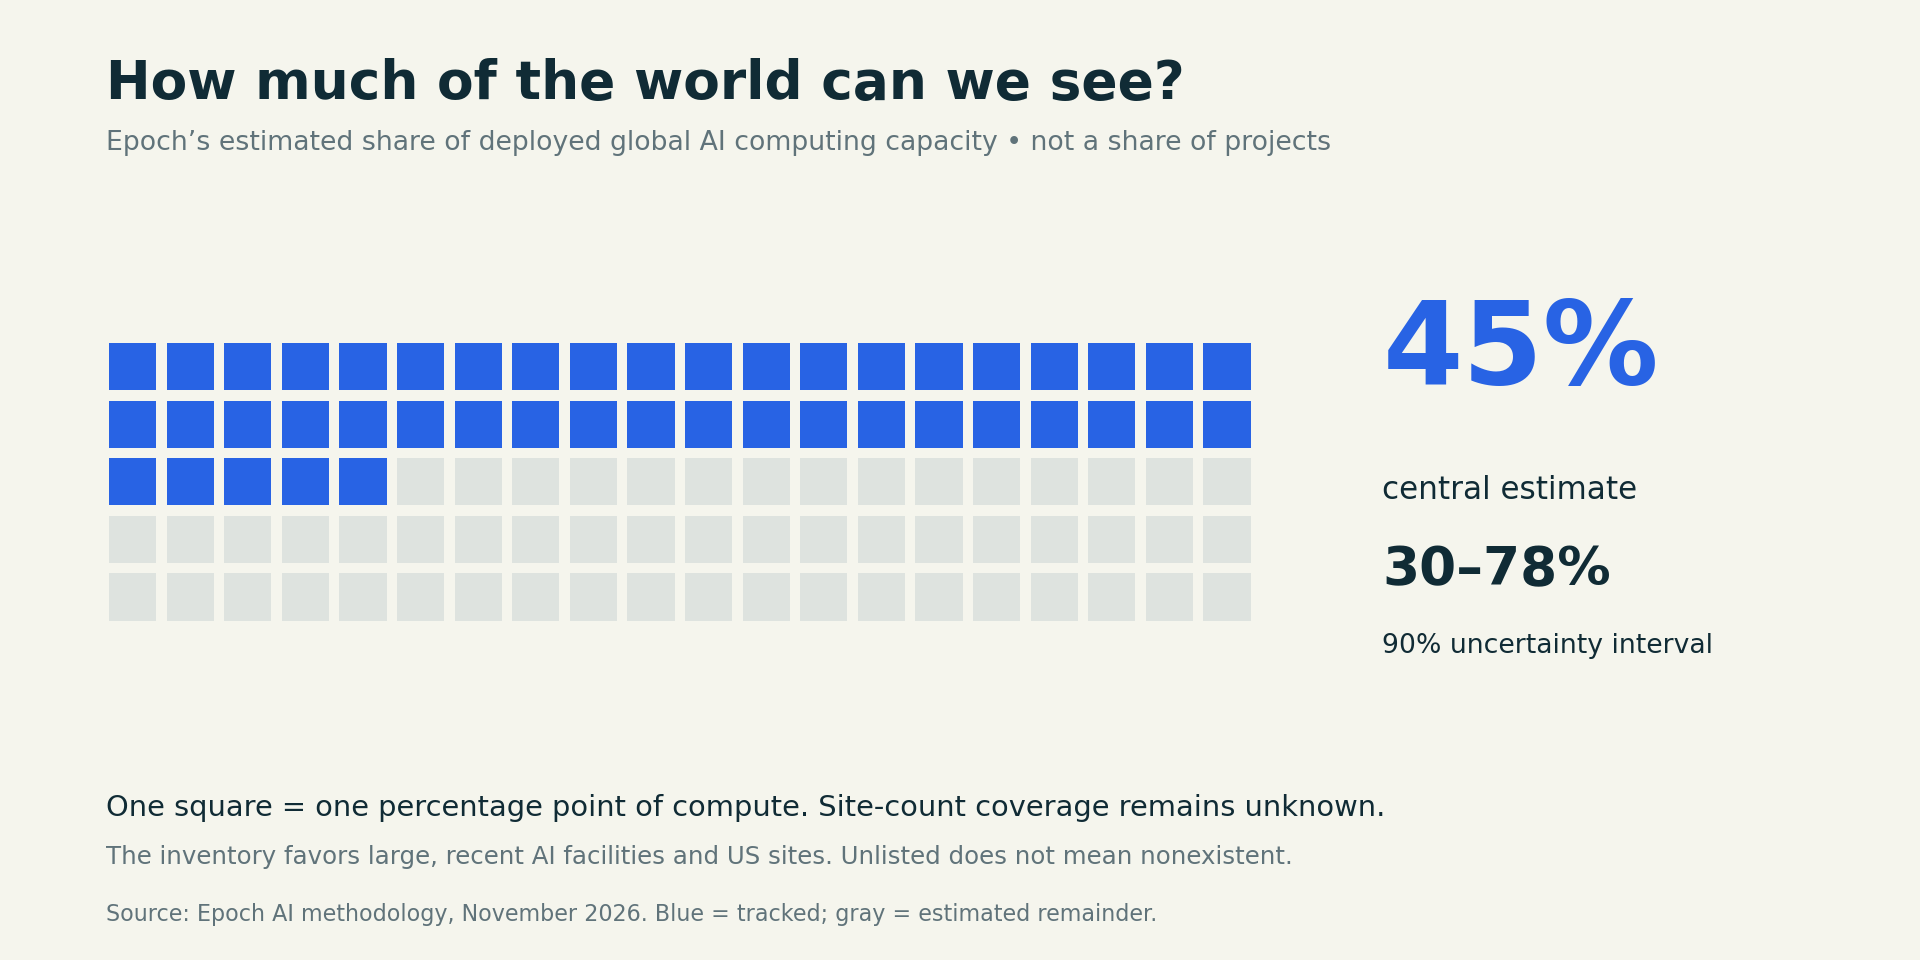
Epoch estimates that its inventory covers 45% of deployed global AI compute, with a 90% uncertainty interval of 30–78%. This does not tell us what percentage of the world’s projects we have found. Large sites carry much more compute than small ones.
Public but not yet assembled. More sites can be found in planning records, operator disclosures and regional inventories. Missing from this sample does not mean secret.
Known sites, missing measurements. Acreage, annual electricity and water are often unavailable on matching boundaries. Blank fields must not become zeros.
Source: Epoch AI methodology. We do not extrapolate a world project count from the number of sites in this selected sample.
Find a site. Compare its scale.
All 96 records are available here, including those without positive current capacity. Open a row for its reported location and the meaning of its status.
96 matching sites · November 1, 2026 estimates
Reported location: 55001 Larrison Blvd, New Carlisle, IN 46552
Positive estimated operating capacity. Additional buildings or phases may still be under construction.
Explore the underlying Epoch AI records ↗Reported location: 5420 Tulane Rd, Memphis, TN 38109
Positive estimated operating capacity. Additional buildings or phases may still be under construction.
Explore the underlying Epoch AI records ↗Reported location: 5502 Spinks Rd, Abilene, TX 79601
Positive estimated operating capacity. Additional buildings or phases may still be under construction.
Explore the underlying Epoch AI records ↗Reported location: 1435 Hwy 54 W, Fayetteville, GA 30214
Positive estimated operating capacity. Additional buildings or phases may still be under construction.
Explore the underlying Epoch AI records ↗Reported location: No address in this snapshot.
Positive estimated operating capacity. Additional buildings or phases may still be under construction.
Explore the underlying Epoch AI records ↗Reported location: 1 Community Cir, New Albany, OH 43054
Positive estimated operating capacity. Additional buildings or phases may still be under construction.
Explore the underlying Epoch AI records ↗Reported location: HP79+MP, 81300 Johor Bahru, Johor, Malaysia
Positive estimated operating capacity. Additional buildings or phases may still be under construction.
Explore the underlying Epoch AI records ↗Reported location: 4800 90th St, Mount Pleasant, WI 53403
Positive estimated operating capacity. Additional buildings or phases may still be under construction.
Explore the underlying Epoch AI records ↗Reported location: 4581 Webb St, Pryor, OK 74361
Positive estimated operating capacity. Additional buildings or phases may still be under construction.
Explore the underlying Epoch AI records ↗Reported location: 3231 Riverport Rd, Memphis, TN 38109
Positive estimated operating capacity. Additional buildings or phases may still be under construction.
Explore the underlying Epoch AI records ↗Reported location: 1101 Beech Rd SW, New Albany, OH 43054
Positive estimated operating capacity. Additional buildings or phases may still be under construction.
Explore the underlying Epoch AI records ↗Reported location: 5076 S High St, Columbus, OH 43207
Positive estimated operating capacity. Additional buildings or phases may still be under construction.
Explore the underlying Epoch AI records ↗
Cost is a model based on IT power, in 2025 dollars. H100 equivalents describe theoretical computing performance, not physical chip counts. Bar lengths show IT power on a common scale.
An open research project.
Our working scope is the worldwide buildout since January 2023, including completed campuses, expansions and AI conversions. Earlier infrastructure provides a baseline; future announcements remain separate. This edition is a documented sample and historical context, not a complete account of every boom-era project.
The charts deliberately keep different populations apart. A Google water-reporting location is not automatically the same boundary as an Epoch AI site. A country without a record is not assigned zero infrastructure. Figures describe their own evidence date and scope.
Take the data with you
City-scale comparisons JSON ↓96-site comparison table CSV ↓Dated site records CSV ↓Google water disclosures CSV ↓Dated land-area examples CSV ↓Complete chart snapshot JSON ↓Sources and interpretation TXT ↓Research and graphics: New Consensus. Site and timeline data: Epoch AI, used with attribution under its Creative Commons Attribution license. Water: Google and IEA. Land: Hines Research, Louisiana Economic Development and Microsoft. Global electricity: IEA. City benchmarks: US Census, NYC DEP and NYC Comptroller. Map boundaries: Natural Earth, public domain. Published November 2026. Sources and snapshots are fixed; this page is not a live feed.